
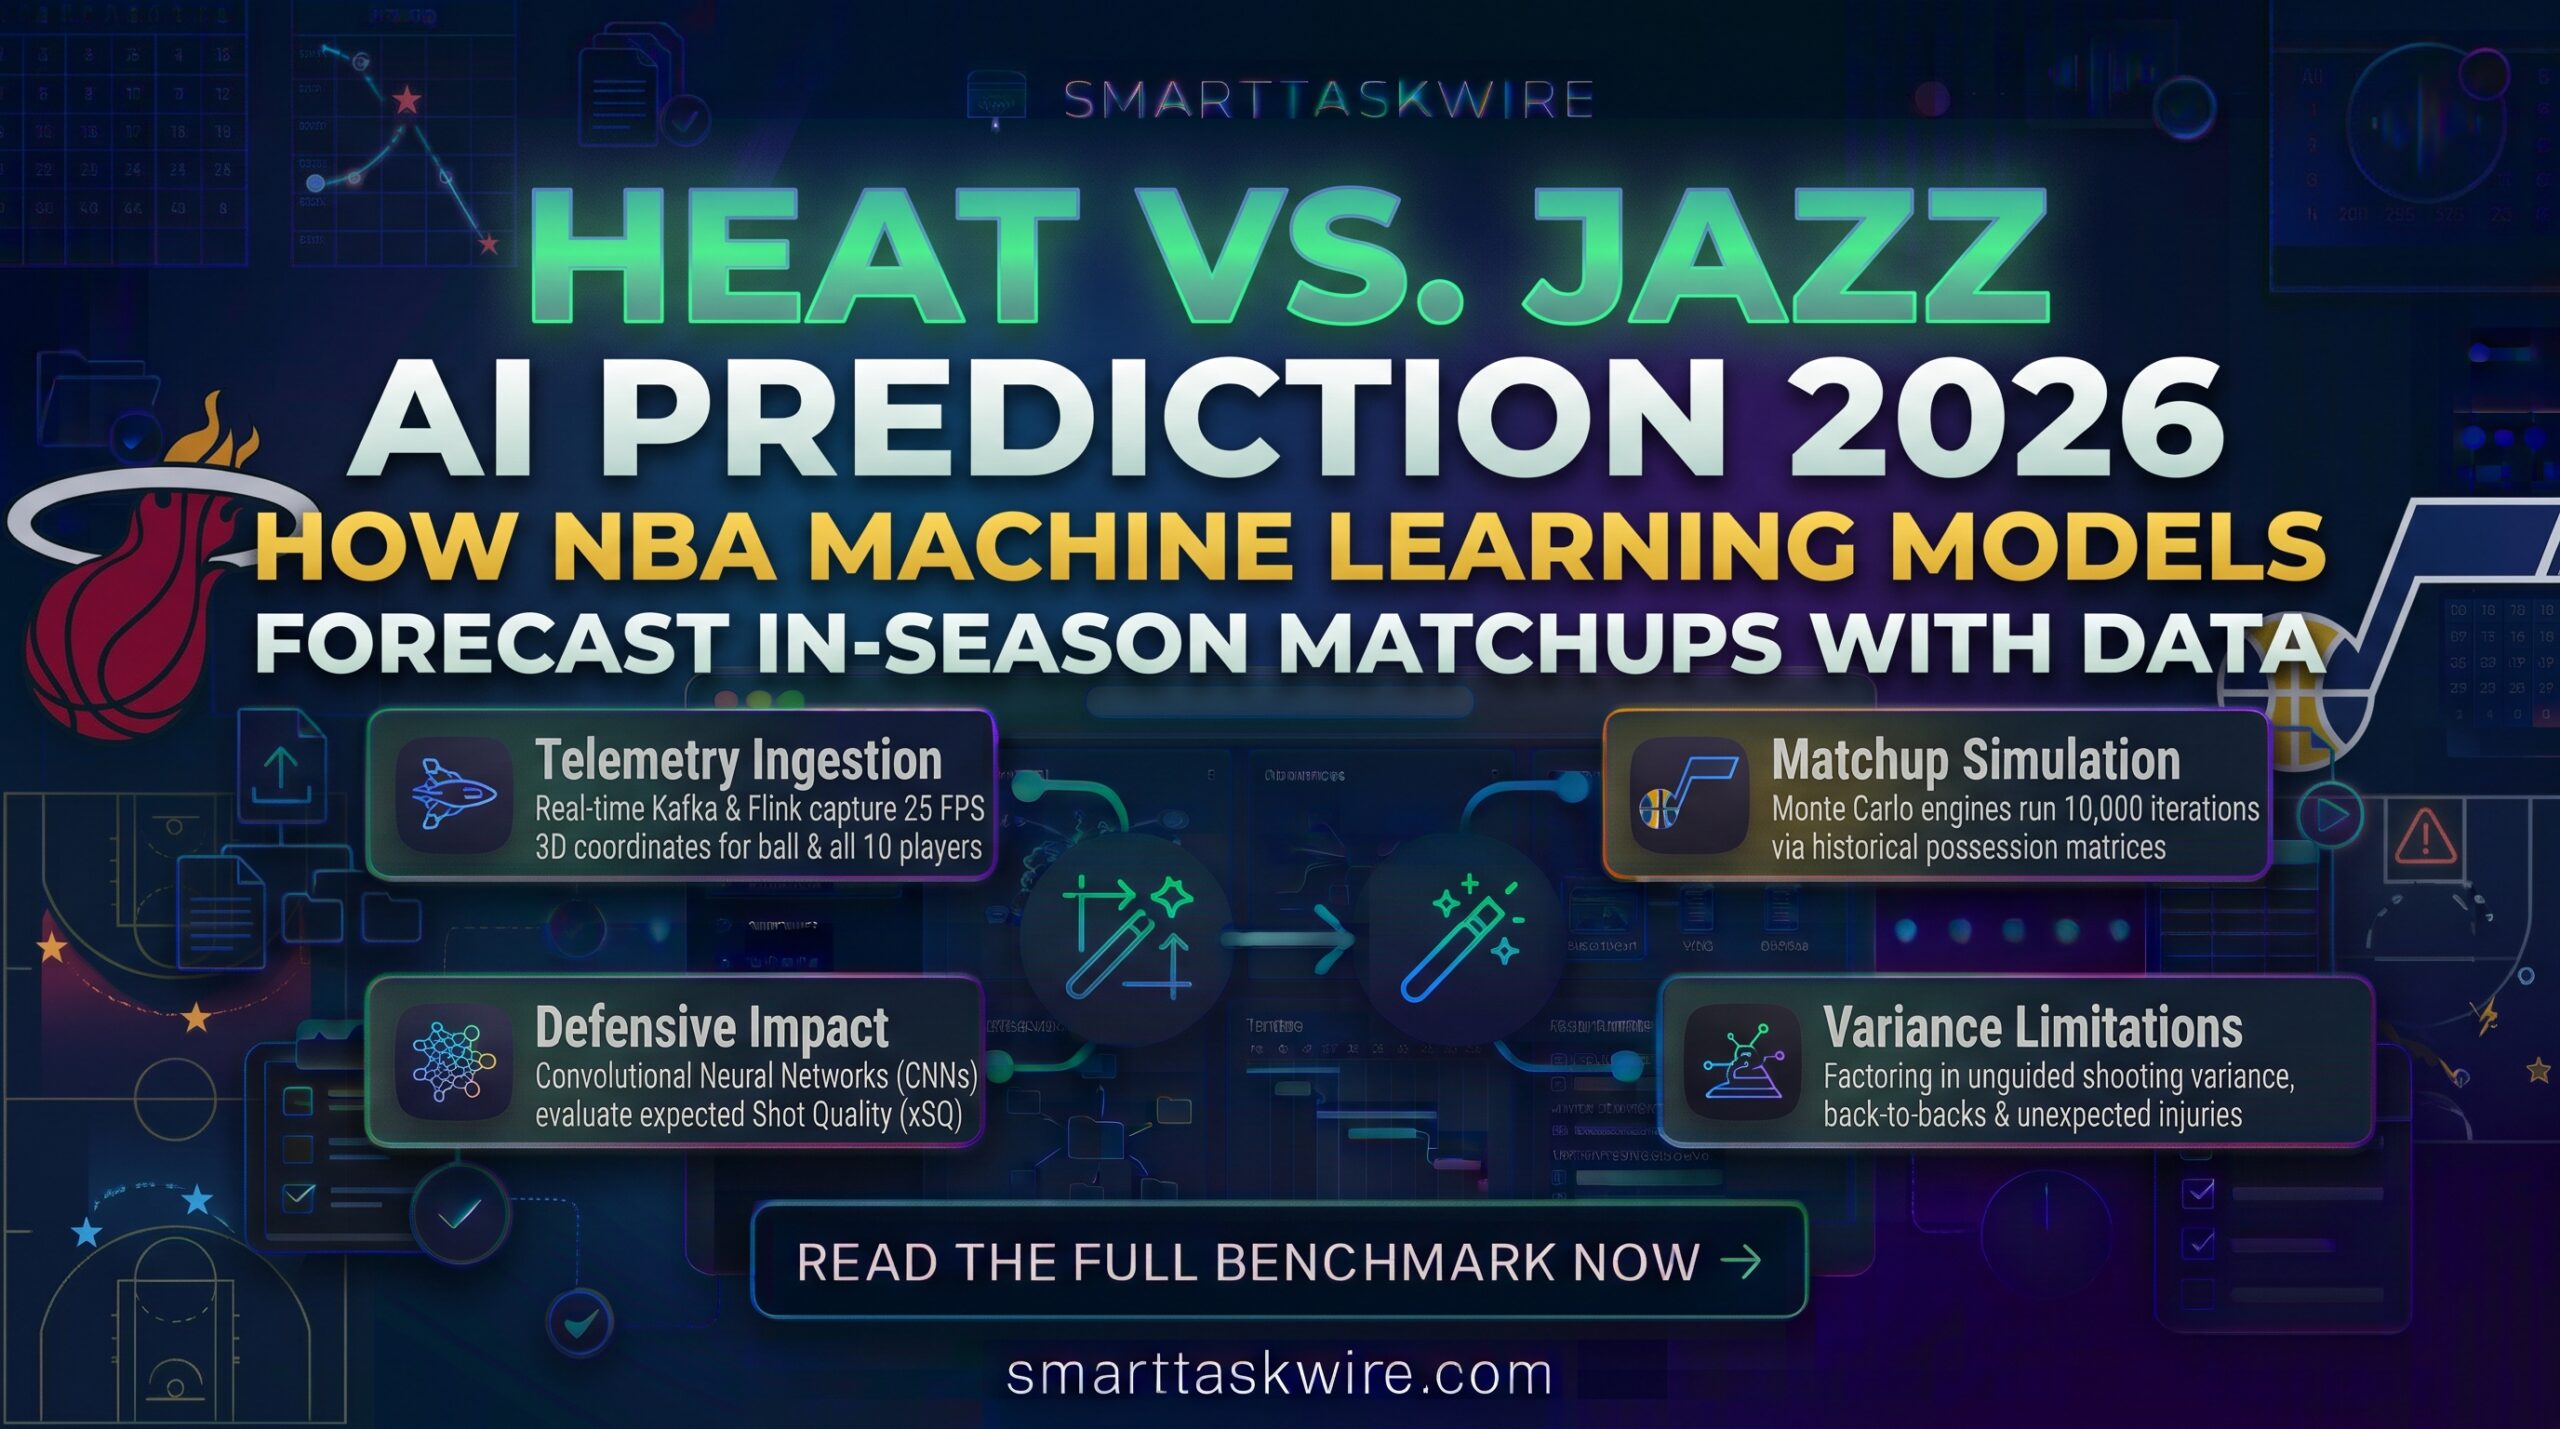
Heat vs Jazz AI Prediction 2026: How Machine Learning Models Forecast In-Season NBA Matchups in 2026
Table of Contents
When two contrasting basketball philosophies clash—such as the defensively rigorous, half-court execution of the Miami Heat meets the high-altitude, transition-heavy pace of the Utah Jazz—fans and sports analysts default to legacy narratives. They analyze roster depth, travel fatigue, and individual star matchups.
Behind the scenes in 2026, quantitative syndicates, sports analytics firms, and data-driven front offices view these matchups differently.
Instead of trusting gut instinct, they utilize an advanced Heat vs Jazz AI prediction 2026 pipeline. By feeding real-time player telemetry, gradient-boosted decision trees, and predictive Monte Carlo simulations into machine learning environments, artificial intelligence can model thousands of game scenarios before the teams even step on the court.
Here is an insider’s look at how sports data scientists deploy machine learning algorithms to dissect, simulate, and predict a highly competitive NBA game like Miami versus Utah.
NBA Machine Learning Pipeline Architecture
| Pipeline Stage | Technology / Models Used | Data Inputs | Output Variable |
| Telemetry Ingestion | Apache Kafka & Flink streaming | Hawk-Eye 3D optical tracking | Real-time spatial coordinates (Ball & 10 Players) |
| Defensive Impact Model | Convolutional Neural Networks (CNNs) | Defender distance, close-out velocity, and screen type | Expected Shot Quality (xSQ) |
| Rotational Impact | Recurrent Neural Networks (RNN) / LSTMs | Lineup Net Rating delta, on-off splits, and player fatigue | Expected offensive/defensive efficiency per 100 possessions |
| Matchup Simulation | Monte Carlo engines (10,000+ iterations) | Historical possession transition matrices | Win Probability & Scoreline Distribution |
Step 1: Ingesting 3D Optical Telemetry Data
Raw box score stats like points, rebounds, and shooting percentages are historical results, not future predictors. Predicting a modern NBA matchup requires assessing unstructured spatial data.
In stadiums like the Kaseya Center in Miami and the Delta Center in Salt Lake City, specialized 12-camera optical tracking systems (by Hawk-Eye and Second Spectrum) capture the 3D position coordinates of the basketball and all ten players on the court at 25 to 60 frames per second.
When preparing a Heat vs Jazz AI prediction 2026, these data pipelines transform raw footage into structured feature metrics:
- True Shot Difficulty: Measuring the shooter’s release angle, speed, and the exact distance of the nearest defender’s hand to evaluate the probability of a shot going in.
- Close-Out Velocity: How quickly a defender (like Miami’s perimeter specialists) covers ground to contest an opponent’s shot (like Utah’s catch-and-shoot players).
- Fatigue and High-Altitude Degradation: The AI factors in Salt Lake City’s 4,200-foot elevation, calculating historic performance drop-offs in sprinting speed and shooting accuracy for visiting road teams like the Heat during late-game quarters.
Plaintext
[ Raw Hawk-Eye / Optical Tracking Logs ]
          │
          ▼
┌────────────────────────────────────────────────────────┐
│               Feature Engineering Layer                │
│  • Off-Ball Spacing & Floor Geometry Check (sq. ft.)   │
│  • Expected Shot Quality (xSQ) vs. Actual Points       │
│  • Defender Close-Out Deceleration & Contest Distance  │
│  • Altitude & Back-to-Back Rest Fatigue Co-efficients  │
└────────────────────────────────────────────────────────┘
          │
          ▼
[ Machine Learning Models (LightGBM, XGBoost, PyTorch) ]
          │
          ▼
[ Monte Carlo Simulator (10,000 Game Matchup Iterations) ]
Step 2: The Machine Learning Feature Engineering
Once the data is ingested, it is fed into predictive models like XGBoost and LightGBM (light gradient-boosted decision trees). These algorithms evaluate thousands of interconnected variables, focusing on key matchup dynamics:
1. Possessions and Pace
The Jazz typically push a high-tempo, transition-focused offense, while the Heat excel at slowing games down into a methodical, half-court half-court grind. Machine learning models analyze these trends to predict the over/under on the game’s total possessions. If Utah’s transition rate is high, the model expects more points; if Miami successfully slows the pace down, the score projection falls.
2. Pick-and-Roll & Spacing Mechanics
Modern AI parses spatial geometry to predict how teams will defend specific plays. For example, the model calculates how Utah’s pick-and-roll ball handlers perform when Miami drops their big men versus when they switch perimeter defenders. Neural networks identify which defensive rotations create the highest number of contested, low-value shots.
3. Lineup Combinations & Travel Fatigue
The algorithm also tracks how second-unit benches perform and how back-to-back travel schedules affect player stamina. Miami’s bench might sustain a defense, but if they are on a back-to-back, the model applies an automatic statistical penalty to their late-game shooting and defensive rotation speeds.
Step 3: Simulating 10,000 Games with Monte Carlo Models
With all variables weighted, the analytics platform runs a Monte Carlo simulation.
Instead of a single “guess,” a Markov chain simulation calculates the probability of every possible action on every single possession—turnover, miss, foul, three-pointer, or transition dunk.
By running this model 10,000 times, the AI creates a bell-curve distribution of the game’s final score. The output is a highly calibrated win probability (e.g., Miami Heat 52.4%, Utah Jazz 47.6%) along with estimated point spreads, rather than an unguided prediction.
Why Predicting Basketball Matches is Hard
No matter how advanced the AI, single-game predictiveness has to contend with a high margin of variance:
- Single-Game Shooting Variance: Even elite shooting teams can occasionally shoot 15% below their average on uncontested, wide-open shots simply due to random variance.
- Unexpected In-Game Injuries: A player turning an ankle in the first quarter completely alters the team’s rotation, rendering all pre-game modeling obsolete.
- Refereeing Styles: Different officiating crews call games with varying levels of strictness, affecting free-throw rates and foul trouble for aggressive interior players.
Leverage AI Analytics in Modern Workflows
The complex machine learning pipelines used to simulate NBA games are built on the same architectures used for enterprise digital workflows:
- Build Data Pipelines: Capture and run automated script triggers with the Best Low-Code AI Workflow Automation Tools in 2026.
- Launch Interactive Backends: Prototype visual tools and predict analytics patterns using Vibe Coding Tools 2026.
- Verify Quantitative Insights: Research citation-backed datasets safely with our favorite Search-to-Research AI Engines 2026.
Whether you’re developing predictive sport science algorithms or setting up cloud data pipelines, machine learning turns complex patterns into actionable, forward-looking insights.
The Wainwright AI Framework: How to Govern & Scale Autonomous Agent Fleets in 2026