
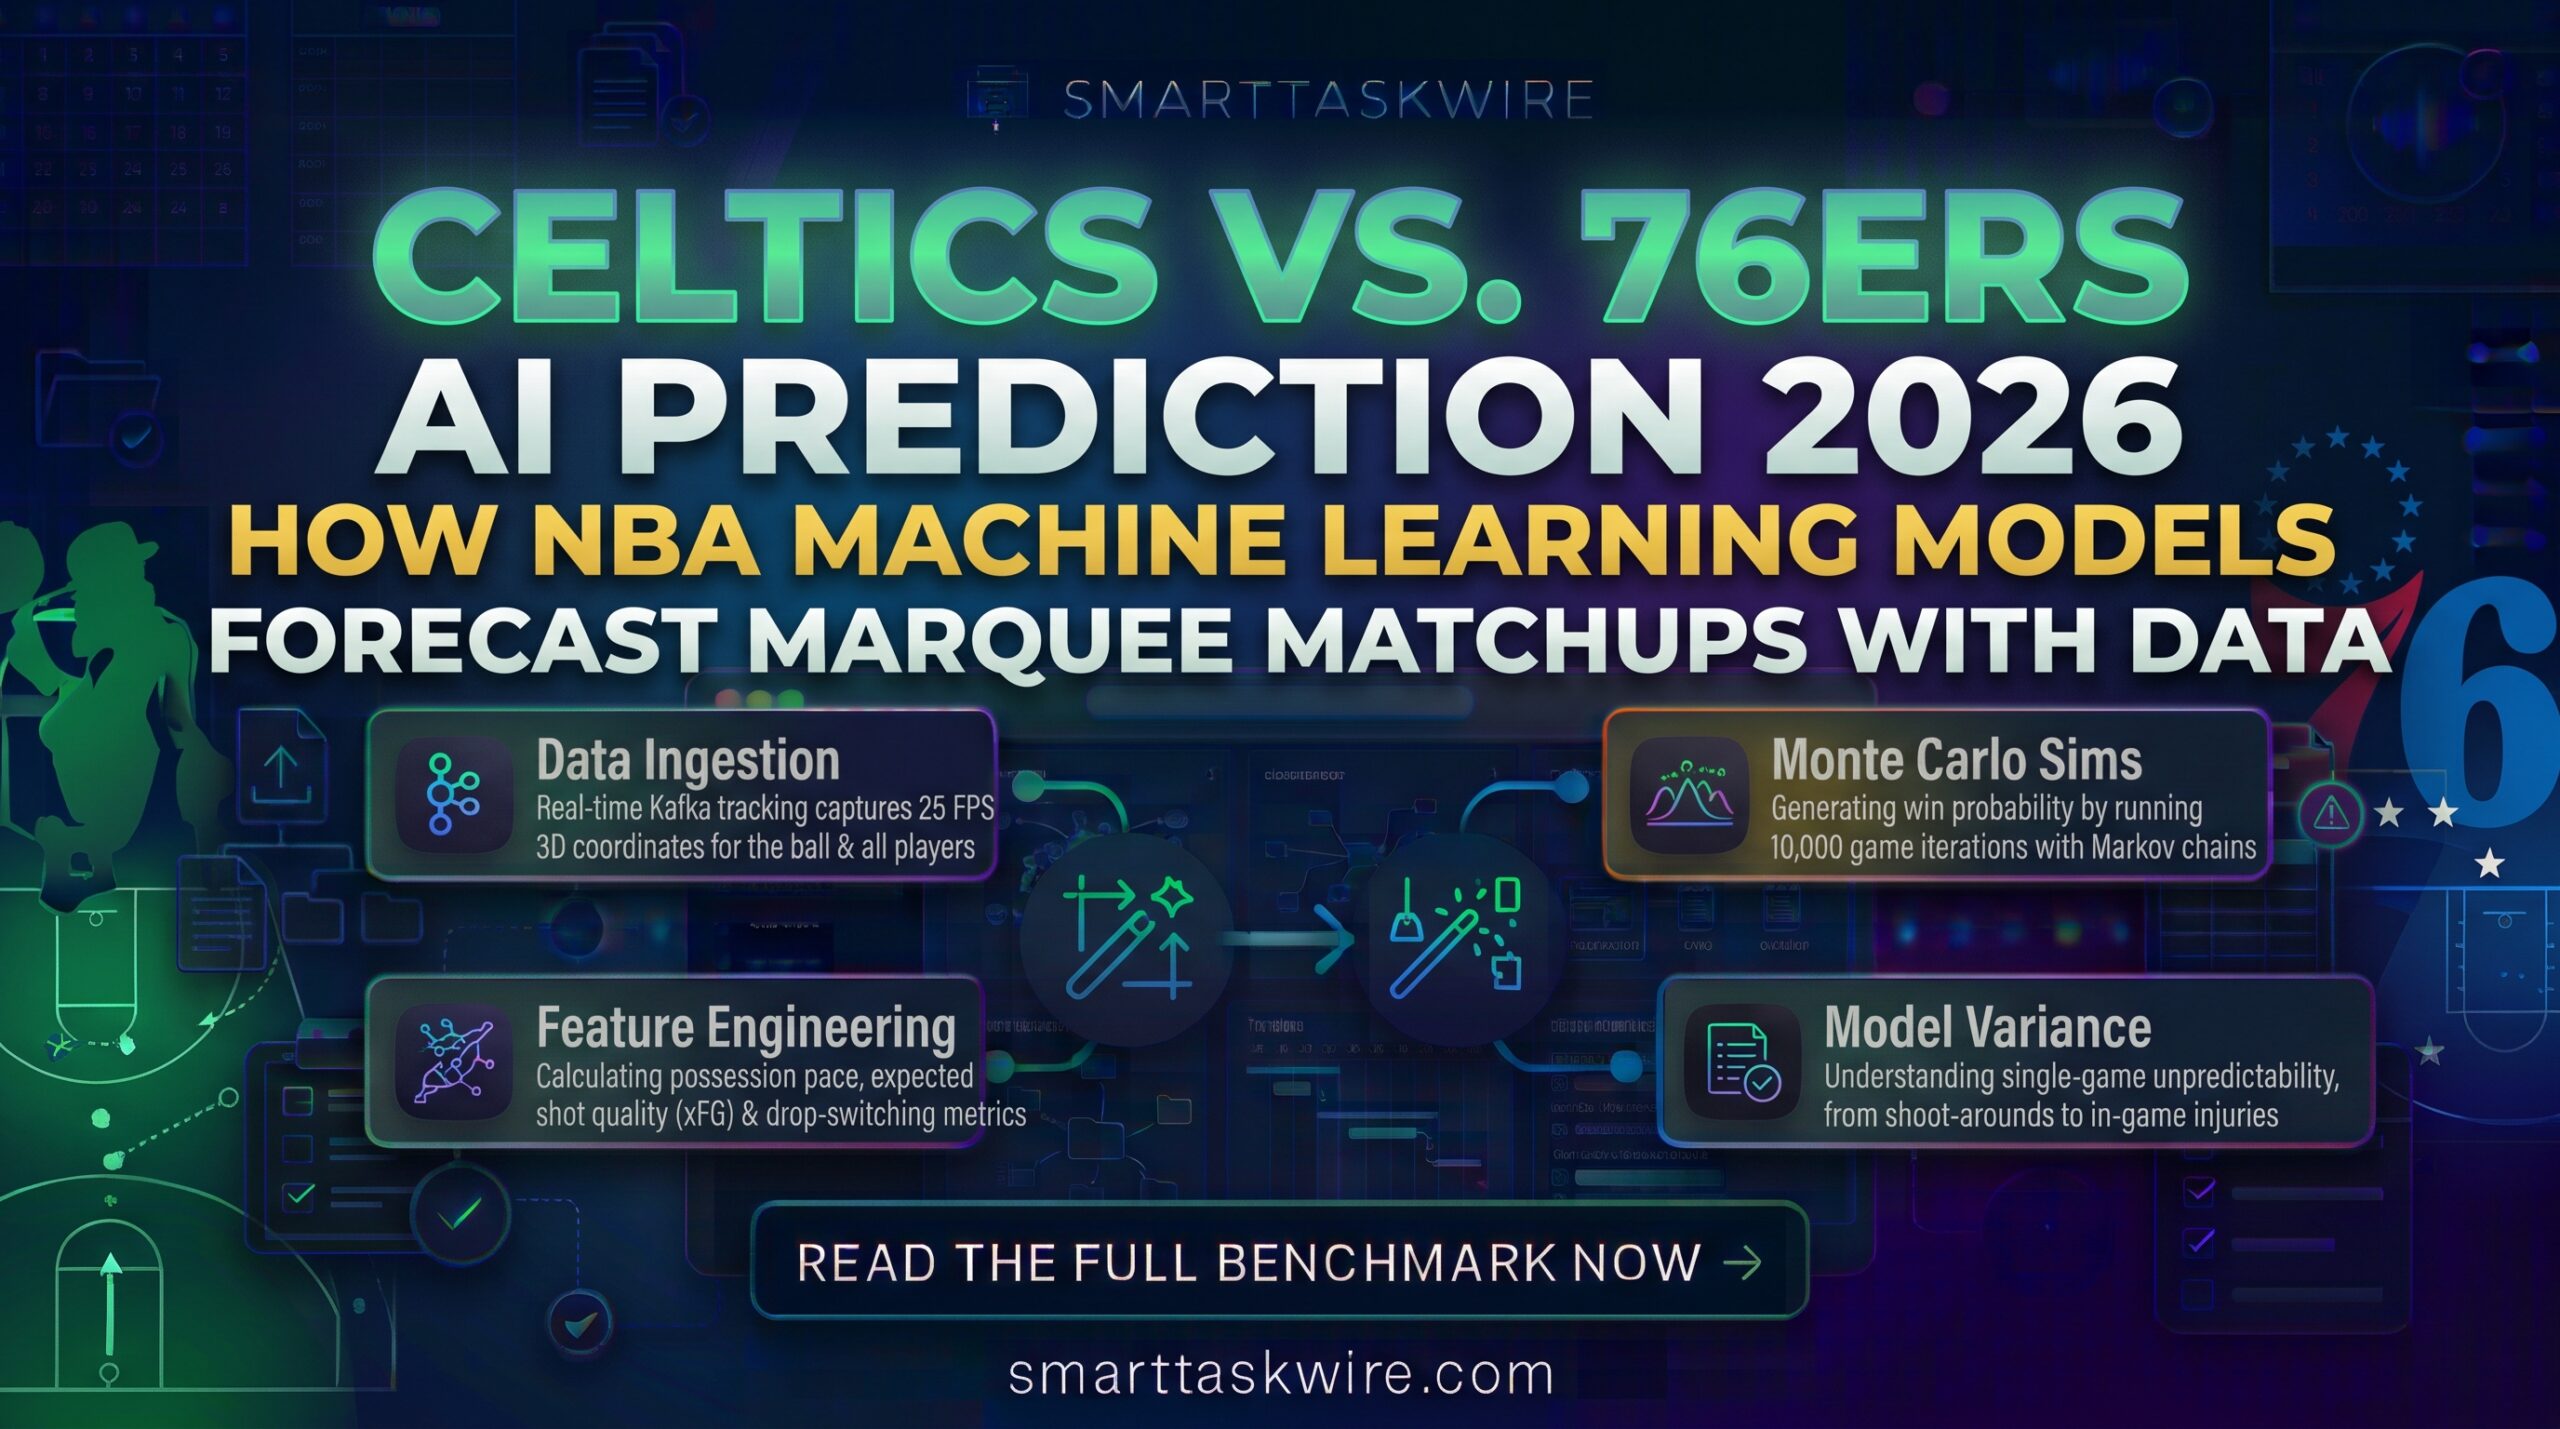
Celtics vs. 76ers AI Prediction: How Machine Learning Models Forecast Marquee NBA Matchups in 2026
Table of Contents
When historic Eastern Conference rivals meet—such as the Boston Celtics facing off against the Philadelphia 76ers—traditional sports media evaluates the matchup through legacy talking points: star power, home-court energy, and rivalry history.
Behind the scenes in 2026, data science teams, quantitative sports syndicates, and front-office analysts analyze games through an entirely different lens.
Gone are the days when sports forecasting relied on basic box scores and field goal percentages. Today, Celtics vs 76ers AI prediction 2026 engines ingest millions of high-frequency spatio-temporal data points. By combining optical tracking cameras, gradient-boosted decision trees, and counterfactual reinforcement learning, artificial intelligence can model thousands of game iterations in seconds.
Examining how machine learning algorithms dissect a high-stakes matchup between Boston and Philadelphia reveals how data scientists structure predictive pipelines and how modern artificial intelligence evaluates competitive basketball.
Key Technical Specs: NBA Machine Learning Pipeline
| Pipeline Stage | Technology / Models Used | Primary Data Source | Key Metric Generated |
| Data Ingestion | Kafka / Apache Flink streaming | Hawk-Eye & Second Spectrum optical cameras | 25 FPS 3D coordinates for ball & all 10 players |
| Shot Quality Modeling | XGBoost / LightGBM classifiers | Historical contest proximity & release angle | Expected Field Goal % (xFG / Shot Difficulty) |
| Lineup Interaction | Neural Matrix Factorization / Transformer embeddings | Play-by-play 5-man substitution logs | Adjusted Net Rating delta ($\Delta$ NetRtg) |
| Game Simulation | Monte Carlo engines (10,000+ runs) | Markov possession transition chains | Win Probability & Scoreline Probability Curves |
Step 1: Processing Spatio-Temporal Tracking Data
Raw box score statistics—like points, rebounds, and assists—are lagging indicators. A player scoring 28 points on heavily contested, off-balance fadeaways represents a vastly different predictive outcome than a player scoring 28 points on uncontested catch-and-shoot looks created by perimeter ball movement.
In modern NBA stadiums (from TD Garden to Xfinity Mobile Arena), optical camera systems capture the 3D position coordinates of the basketball and all ten players at 25 frames per second.
When analyzing Celtics vs 76ers AI prediction 2026 models, algorithms calculate:
- Defensive Contest Proximity: The Euclidean distance between the shooter’s release point and the nearest defender’s outstretched fingertips.
- Floor Spacing Geometry: The convex hull area formed by perimeter shooters, quantifying how much operating space an interior driver possesses.
- Transition Velocity: The acceleration rate of transition wings running lanes versus retreat defense recovery speeds.
Step 2: The Machine Learning Features That Decide the Matchup
Predictive models do not treat teams as unified blocks. They evaluate matchups as dynamic interactions between individual play-type tendencies:
Plaintext
[ Raw Tracking & Lineup Logs ]
          │
          ▼
┌────────────────────────────────────────────────────────┐
│               Feature Engineering Layer                │
│  • Effective Possession Pace (Possessions / 48 min)    │
│  • True Shooting (TS%) over Expected Shot Quality (xFG)│
│  • Pick-and-Roll Drop vs. Switch Defensive Efficacy    │
│  • Rest Fatigue Factor (Back-to-Back Travel Penalty)   │
└────────────────────────────────────────────────────────┘
          │
          ▼
[ Gradient-Boosted Trees (LightGBM / XGBoost) ]
          │
          ▼
[ Monte Carlo Simulator (10,000 Run Matchup Probabilities) ]
1. Boston’s Perimeter Volume vs. Philadelphia’s Interior Drop
The Celtics’ offensive framework relies on heavy three-point distribution and drive-and-kick spacing. Machine learning models evaluate Philadelphia’s rim-protection schemes (typically drop coverage anchored by their frontcourt) against Boston’s pull-up three-point efficiency.
If an algorithm flags that a center’s average contest depth drops more than 4.5 feet below the three-point arc on screen actions, the model adjusts Boston’s expected offensive rating upward due to uncontested above-the-break looks.
2. Isolating Fatigue and Lineup Rotations
AI architectures weigh physical variables that human commentators often overlook:
- Back-to-Back Travel Distance: Algorithms apply historical degradation penalties to perimeter shooting efficiency when a road team travels across multiple time zones without a full rest day.
- Second-Unit Degradation: When starting stars sit, models instantly switch from primary scoring metrics to bench-specific net ratings, assessing whether a secondary rotation can sustain offensive pace.
Step 3: Counterfactual Inference and Monte Carlo Simulations
Once feature weights are established, advanced sports analytics platforms (including the AWS-powered NBA analytics architecture) deploy counterfactual modeling.
Instead of asking simply “Who wins?”, the system runs thousands of alternate possessions:
- What happens to the win probability if Philadelphia turns the ball over on an early cross-court pass?
- How does Boston’s possession leverage shift if an offensive rebound extends the shot clock?
By simulating the matchup 10,000 times through a Monte Carlo framework, the engine generates an outcome distribution curve. Rather than an absolute prediction, it yields a calibrated win percentage (e.g., Boston 56.4% win probability, Philadelphia 43.6%) alongside confidence intervals for total expected possessions.
Why Machine Learning Models Still Face High Variance
Despite processing billions of data points, sports prediction models encounter unique boundaries that pure software automation cannot fully solve:
- High Inherent Randomness: Three-point shooting variance is notoriously unpredictable in single-game sample sizes. Even the best analytical models cannot forecast an elite shooter shooting 2-of-12 on wide-open attempts.
- Dynamic In-Game Injuries: An early-game ankle roll or unexpected foul trouble instantly renders pre-game rotation weights obsolete.
- Referee Whistle Sensitivity: Game-to-game variance in whistle strictness alters free-throw rates, heavily impacting teams that rely on interior post play compared to perimeter-centric units.
Connecting Predictive Modeling to Modern AI Workflows
The mathematical frameworks applied in NBA analytics match the enterprise machine learning engines used across business operations:
- Deploy Low-Code Workflows: Connect real-time API webhooks and data feeds using our guide to the Best Low-Code AI Workflow Automation Tools in 2026.
- Build Custom Code Sandboxes: Write automated statistical parsers and Python scrapers with assistance from Vibe Coding Tools 2026.
- Verify Machine Outputs: Understand how to audit algorithmic models before relying on automated conclusions in our review of Search-to-Research AI Engines 2026.
Whether analyzing complex software architectures or simulating a Celtics-76ers clash on the court, predictive AI demonstrates that the future of decision-making belongs to structured data and objective pattern recognition.